Happy New Year!

Our Impact

FY 23 Impact

  • Individuals Icon9,000 individuals served weekly on average across all food programs
  • Meals Icon4.9 million meals, 5.5 million pounds of food distributed
  • Produce Icon1.9 million pounds of produce distributed
  • Mobile Market Icon40,000 individuals served through the Mobile Market
  • SPAF Icon750 families participated in our Sponsor a Family Program
  • Volunteer Icon7,700 hours of volunteer service
  • Volunteer 2 Icon$3.4 million in entitlements secured (SNAP, TANF, Medicaid)
  • Tax Refunds Icon$1.8 million in tax refunds through our partnership with Grow Brooklyn
  • Baby & Personal Care Icon3,000 baby and personal care kits were distributed
  • Mail Service Icon438 individuals regularly accessed onsite mail service

Demographics

292,961 Guests Across All Services

65% at or below poverty level 20% elderly & mentally compromised 15% homeless
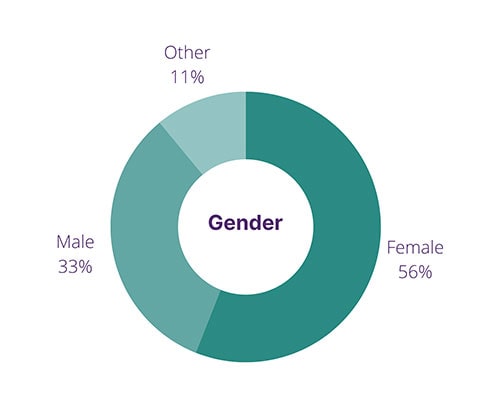
Demographics - Gender
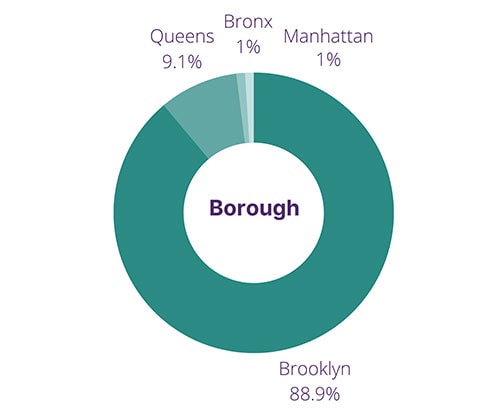
Demographics - Borough
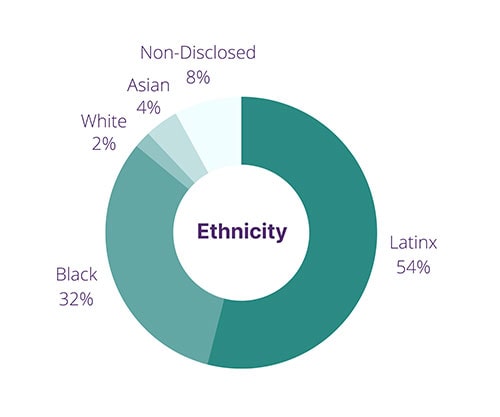
Demographics - Ethnicity

Our client base has fundamentally shifted since the pandemic began

Since the beginning of COVID, we have seen our demographics rapidly shift, with Latinx clients doubling, and the Asian population tripling; this is due to extensive outreach into 20+ communities in Brooklyn and Queens. Numbers in local catchment areas remained steady.

Interested in Supporting St. John’s Bread & Life?

You can help make an impact in the lives of so many of our less fortunate by helping us to continue our mission.

Volunteer Donate Ways to Give